<-- previous page Table of Contents Index next page -->
The "line" statement is used for drawing lines. Its format is:
linetype line (X1, Y1) to (X2, Y2)
The x and y coordinates are specified as was described
in the section on
"Location tags."
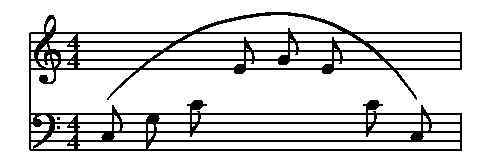
score
  vscheme=2f
  staff2 clef=bass

music
1 1: c+ =c;e =e;g;c+;
1 2: e =_e;g =_g;c =_c;s;
2 1: 2.s;4g =_gg;
2 2: 1ce;
line (c.e + 2, c.y) to (e.w - 2, e.y)
line (_e.e + 2, _e.y) to (_g.w - 2, _g.y)
dashed line (_c.e + 1, _c.y) to (_gg.w - 1, _gg.y)
bar

It is possible to print a text string by the line by adding
with fontfamily font (size) "string" side
1: 2d =n; g+ =m;
wavy line (n.e + 1.5, n.y) to (m.w - 1.5, m.y) with ital (9) "gliss."
bar

Arbitrary curves can be drawn using the "curve" statement:
linetype curve (X1,Y1) to (X2,Y2) to (X3,Y3) ...
score
staffs=2

staff 2
  clef=bass

music
1: 4.s;[=c] 8e; [=d] g; [=e] e;4s;
2: [=a] 8c;g; [=b] c+;4.s; [=f] 8c+; [=g] c;
medium curve (a.x, a.n+1) to (b.x, b.n+15) to (c.x, c.n+4) \
		to (d.x, d.n+3) to (e.x, e.n+3) \
		to (f.x, f.n+11) to (g.x, g.n+1)
bar

An alternative way to specify a curve is to only specify the two endpoints,
along one or more "bulge" values, given in stepsizes.
Suppose a single bulge value n is given. To find the midpoint of
the resulting curve, imagine a line is drawn between the two endpoints,
then from the midpoint of that line, move perpendicular to the line for
n stepsizes.
A positive n will cause the curve to bulge
to the left as you move from the start point to the end point,
while a negative n will make it bulge to the right.
If two bulge values are given, bulges are calculated from the 1/3 and
2/3 point of the line between the endpoints; with three points, at 1/4,
1/2, and 3/4, and so forth. Multiple bulge values are separated by commas.
1: c =_c1; f; f; d =_d1;
medium curve (_c1.x, _c1.y + 8) to (_d1.x, _d1.y + 10) bulge 3
bar

1: g =_g1; e+; d+; a =_a1;
dotted curve (_g1.x, _g1.y - 2) to (_a1.x, _a1.y - 2) bulge -4.3
bar

1: g =_g2; a; d+; c+ =_c2;
curve  (_g2.x, _g2.y - 2) to (_c2.x, _c2.y + 2) bulge -2.5, 4
bar
